

파이썬으로 만드는 "월간 독서 탑" 시각화

오송인
•조회수 472

최종 결과물입니다. 원래 하단에서부터 쌓아 올려야 하는데 반대로 된 거 빼면 만족합니다.
리더스앱에서 이런 식으로 읽은 책을 매월 보여주더라고요. 파이썬으로 가능할 것 같아서 구현시도했습니다. 2시간 반 걸렸네요.
옵시디언에 아래와 같은 식으로 책 메타데이터를 기록 중입니다.
---
title: 당신도 느리게 나이 들 수 있습니다(리커버:K) (나이가 들어도 몸의 시간은 젊게)
author: 정희원
publisher: 더퀘스트
coverSmallUrl: https://shopping-phinf.pstatic.net/main_3662593/36625938623.20230725121514.jpg
publishDate: 2023
link: https://search.shopping.naver.com/book/catalog/36625938623
isbn: 9791140702589
isbn13: 9791140702589
created: 2024-06-20T14:34
updated: 2024-07-15T21:09
end: 2024-07-15
start: 2024-06-20
status: finish
rating: ★★★★
tags:
  - book
---
옵시디언 book search 플러그인으로 책 정보를 받아 오면 위 내용과 같이 메타데이터가 생성됩니다. isbn13까지는 자동으로 생기고 (아마도) created 부터는 제가 설정한 것입니다.
이 메타데이터 중 status가 finish인 책만 모아서 csv 파일로 만들어야 했습니다. dataviewjs 사용합니다.
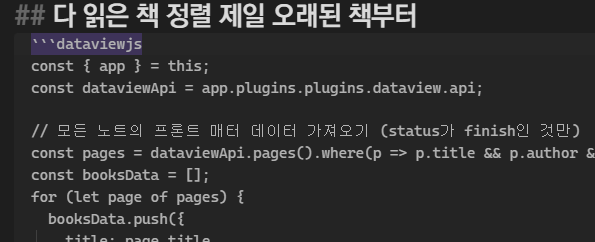
const { app } = this;
const dataviewApi = app.plugins.plugins.dataview.api;
// 모든 노트의 프론트 매터 데이터 가져오기 (status가 finish인 것만)
const pages = dataviewApi.pages().where(p => p.title && p.author && p.start && p.end && p.coverSmallUrl && p.status === 'finish');
const booksData = [];
for (let page of pages) {
booksData.push({
title: page.title,
author: page.author,
start: page.start,
end: page.end,
coverSmallUrl: page.coverSmallUrl
});
}
// start 날짜 순으로 정렬
booksData.sort((a, b) => new Date(a.start) - new Date(b.start));
// Function to escape and quote fields if necessary
const quoteField = (field) => {
field = String(field); // Convert field to string
if (field.includes('"')) {
field = field.replace(/"/g, '""'); // Escape double quotes
}
if (field.includes(',') || field.includes('"')) {
return `"${field}"`;
}
return field;
};
// 텍스트 형식으로 데이터 출력
const header = 'title,author,start,end,coverSmallUrl\n';
const rows = booksData.map(book => [
quoteField(book.title),
quoteField(book.author),
quoteField(book.start),
quoteField(book.end),
quoteField(book.coverSmallUrl)
].join(',')).join('n');
const textContent = header + rows;
console.log("Text Content: n", textContent); // 콘솔 출력
// 텍스트 내용을 노트에 출력
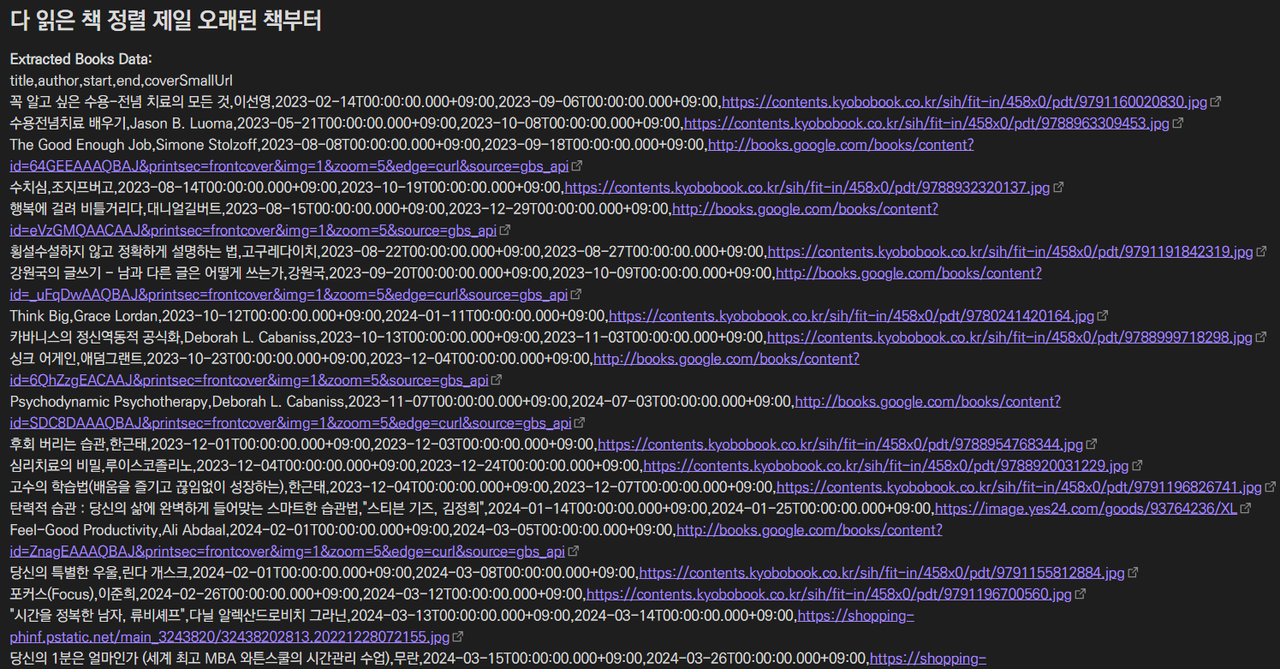
dv.paragraph("Extracted Books Data:n" + textContent);
// 노트 파일에 저장 (옵션)
const fileName = "books_data.csv";
const fileContent = textContent;
app.vault.create(fileName, fileContent).then(() => {
console.log(`File ${fileName} created successfully.`);
}).catch(err => {
console.error(`Failed to create file ${fileName}:`, err);
});그럼 아래처럼 csv 파일 내용이 생깁니다. 메모장에 복붙해서 확장자를 csv로 저장합니다.
이제 파이썬 코드를 실행할 차례입니다.
아래 파이썬 코드로 돌릴 때
# 다운로드 폴더 경로 설정
download_folder = 'C:\Users\space\Downloads'
csv_file_path = os.path.join(download_folder, 'books_data1.csv')
이 부분만 자신의 csv 파일이 저장된 폴더 경로와 csv 파일 이름으로 수정합니다.
전체 코드입니다.
import pandas as pd
import requests
from PIL import Image, ImageDraw, ImageFont
from io import BytesIO
import matplotlib.pyplot as plt
import os
from collections import OrderedDict
import csv

# 다운로드 폴더 경로 설정
download_folder = 'C:\Users\space\Downloads'
csv_file_path = os.path.join(download_folder, 'books_data1.csv')

# CSV 파일 읽기
try:
    df = pd.read_csv(csv_file_path, quoting=csv.QUOTE_ALL, escapechar='\')
except pd.errors.ParserError as e:
    print(f"CSV 파일을 읽는 중에 오류가 발생했습니다: {e}")
    print("CSV 파일의 형식을 확인하고, 필요하다면 수동으로 수정해주세요.")
    raise
except FileNotFoundError as e:
    print(f"CSV 파일이 경로에 없습니다: {csv_file_path}")
    raise
except Exception as e:
    print(f"예상치 못한 오류가 발생했습니다: {e}")
    raise


# 읽기 완료 날짜를 datetime 형식으로 변환
df['end'] = pd.to_datetime(df['end'])

# 월별 데이터 정리 (최신 순으로 정렬)
monthly_data = df.sort_values('end', ascending=False).groupby(df['end'].dt.to_period('M'))

# 이미지 리스트 초기화
monthly_images = OrderedDict()

# 각 월별 데이터를 반복하면서 이미지를 다운로드하고 저장
for month, data in monthly_data:
    images = []
    for _, row in data.iterrows():
        response = requests.get(row['coverSmallUrl'])
        img = Image.open(BytesIO(response.content))
        images.append(img)
    monthly_images[str(month)] = images

# 이미지 크기 설정
width, height = 200, 300
month_label_height = 50  # 월과 책 권수를 표시하기 위해 높이를 늘림

# 월별 이미지 생성
monthly_combined_images = []
for month, images in monthly_images.items():
    total_height = height * len(images) + month_label_height
    combined_image = Image.new('RGB', (width, total_height), color='white')

    # 월 및 책 권수 표시 (상단에)
    draw = ImageDraw.Draw(combined_image)
    font = ImageFont.load_default()
    month_text = f"{month} - {len(images)} books"
    text_bbox = draw.textbbox((0, 0), month_text, font=font)
    text_width = text_bbox[2] - text_bbox[0]
    text_height = text_bbox[3] - text_bbox[1]
    draw.text(((width - text_width) / 2, (month_label_height - text_height) / 2), month_text, fill='black', font=font)

    # 책 표지 이미지 붙이기 (상단부터)
    y_offset = month_label_height
    for img in images:
        resized_img = img.resize((width, height))
        combined_image.paste(resized_img, (0, y_offset))
        y_offset += height

    monthly_combined_images.append(combined_image)

# 전체 이미지 크기 계산
total_width = width * len(monthly_combined_images)
max_height = max(img.size[1] for img in monthly_combined_images)

# 새 이미지를 생성하여 월별 이미지를 수평으로 정렬
final_image = Image.new('RGB', (total_width, max_height), color='white')

x_offset = 0
for img in monthly_combined_images:
    final_image.paste(img, (x_offset, 0))
    x_offset += width

# 생성된 이미지를 파일로 저장
output_file_path = os.path.join(download_folder, "all_months_books_labeled_with_counts.png")
final_image.save(output_file_path)

# 이미지를 시각화
plt.figure(figsize=(20, 10))
plt.imshow(final_image)
plt.axis('off')
plt.title("Books Read by Month (Most Recent at Top)")
plt.show()

print(f"이미지가 {output_file_path}에 저장되었습니다.")